
Evaluating the Stability of NFL Pass-Rush Metrics


Header images sourced from PFF/Getty Images (Photo by Peter G. Aiken/Getty Images) and the Associated Press (AP Photo/Matt Durisko).
Introduction
Pass-rush evaluation in football has increasingly moved beyond raw sack totals, but there is still substantial disagreement regarding which metrics actually best represent pass-rush ability. While sacks remain the most publicly recognized statistic for edge defenders, modern tracking data has introduced additional measures such as pressures, quarterback hits, hurries, pass-rush wins, and pressure rate. However, many of these metrics are themselves imperfect and inconsistently defined.
One of the major challenges in pass-rush analysis is that concepts like “pressure” are not standardized across the industry. Different data providers define pressures differently, and even within charted datasets, quarterback hits and hurries may involve subjective interpretation. Some pressures occur because a defender cleanly defeats a blocker, while others may result from quarterback movement, offensive breakdowns, or cleanup opportunities created by teammates.
Because of this ambiguity, an important question emerges:
Which pass-rush metrics actually reflect repeatable individual skill?
This study examines the year-to-year stability and predictive power of several commonly used NFL edge pass-rush metrics in order to determine which statistics are most sustainable over time and which are most useful for projecting future sack production.
Rather than focusing exclusively on whether sacks are “lucky” or “random,” the goal of this paper is to identify which pass-rush metrics consistently persist across seasons and which metrics appear heavily influenced by volatility.
Data Collection and Methodology
The dataset for this study was constructed using NFL edge defender data from the 2016 through 2024 seasons.
Player statistics were collected primarily through PFF Premium Stats and exported into season-by-season CSV datasets. Each yearly dataset included both volume and efficiency-based pass-rush metrics for qualifying EDGE defenders.
The datasets were cleaned and merged in Python using player names and consecutive-season matching. To improve stability and reduce small-sample volatility, players were required to record at least 200 pass-rush snaps in consecutive seasons to qualify for inclusion.
After applying the snap threshold and matching players across seasons, the final dataset produced 457 consecutive-season observations.
The following metrics were analyzed:
Pass Rush Usage % — Percentage of snaps spent rushing the passer
Pass Rush Win Rate — Percentage of pass-rush reps resulting in a win
Pressures — Total quarterback pressures generated
Pressure Rate — Pressures per pass-rush snap
Sacks — Total sacks recorded
Sack Rate — Sacks per pass-rush snap
Sack Conversion Rate — Percentage of pressures converted into sacks
Pass Rush Wins — Total pass-rush wins generated
Wins Per Snap — Pass-rush wins per snap
Expected Sacks — Estimated sack total based on pressure generation
Sack Residual — Actual sacks minus expected sacks
Pass Rush Grade — Overall pass-rush performance grade
Because many pass-rush statistics lack uniform standards across data providers, this study uses PFF’s charting definitions for all pass-rush metrics analyzed. Accordingly, pressures, hurries, quarterback hits, pass-rush wins, and related statistics should be interpreted within the context of PFF’s proprietary grading and tracking system.
Year-to-year stability was measured using Pearson correlation coefficients.
A Pearson correlation coefficient measures how strongly two variables move together. In this study, it measures how closely a player’s Year 1 performance in a metric is aligned with their Year 2 performance in the same metric.
Correlation values range from:
1.0 = perfect positive relationship
0 = no relationship
-1.0 = perfect negative relationship
Higher correlations indicate greater year-to-year stability and repeatability.
In addition to correlation analysis, single-variable linear regression models were created to test how strongly each Year 1 metric predicted Year 2 sack production. Predictive power was measured using R² values.
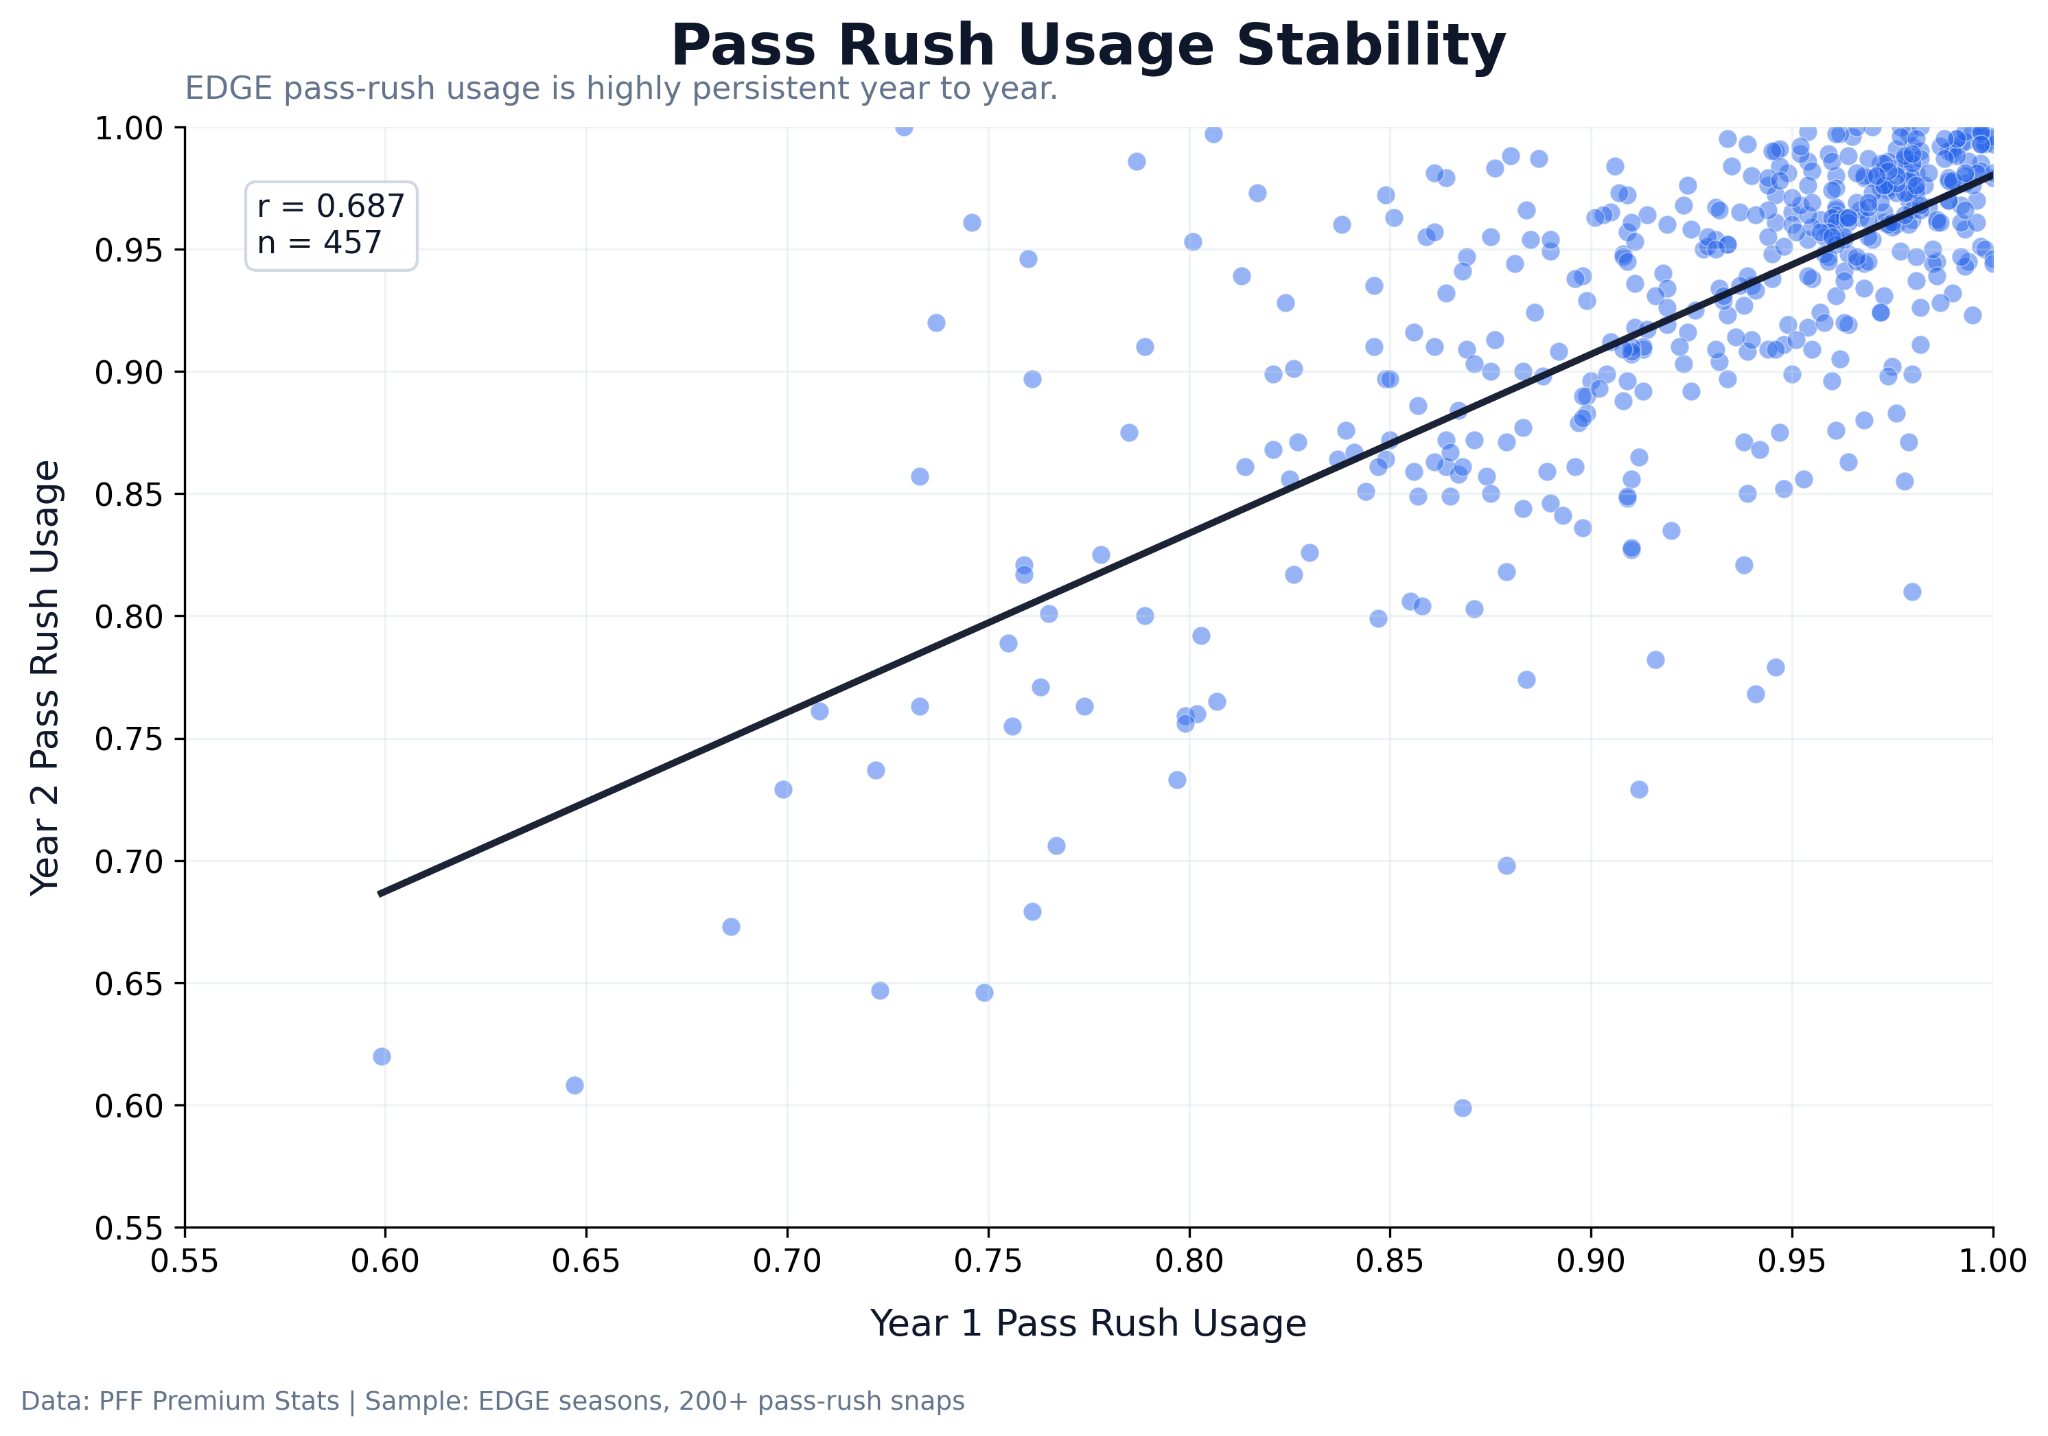
Pass-Rush Usage Stability
Pass-rush usage percentage produced one of the strongest year-to-year relationships in the dataset.
The observed correlation was:
r = 0.687
This suggests that pass-rush deployment is highly role-dependent and remains relatively stable across seasons.
Players who were primarily used as pass-rush specialists in one season generally maintained similar responsibilities in subsequent years. This finding is important because pass-rush opportunity heavily influences production totals. Edge defenders with consistently high pass-rush usage naturally accumulate more opportunities to generate sacks and pressures than hybrid defenders with larger run-defense roles.
The stability of usage reinforces the importance of contextualizing production metrics relative to opportunity.
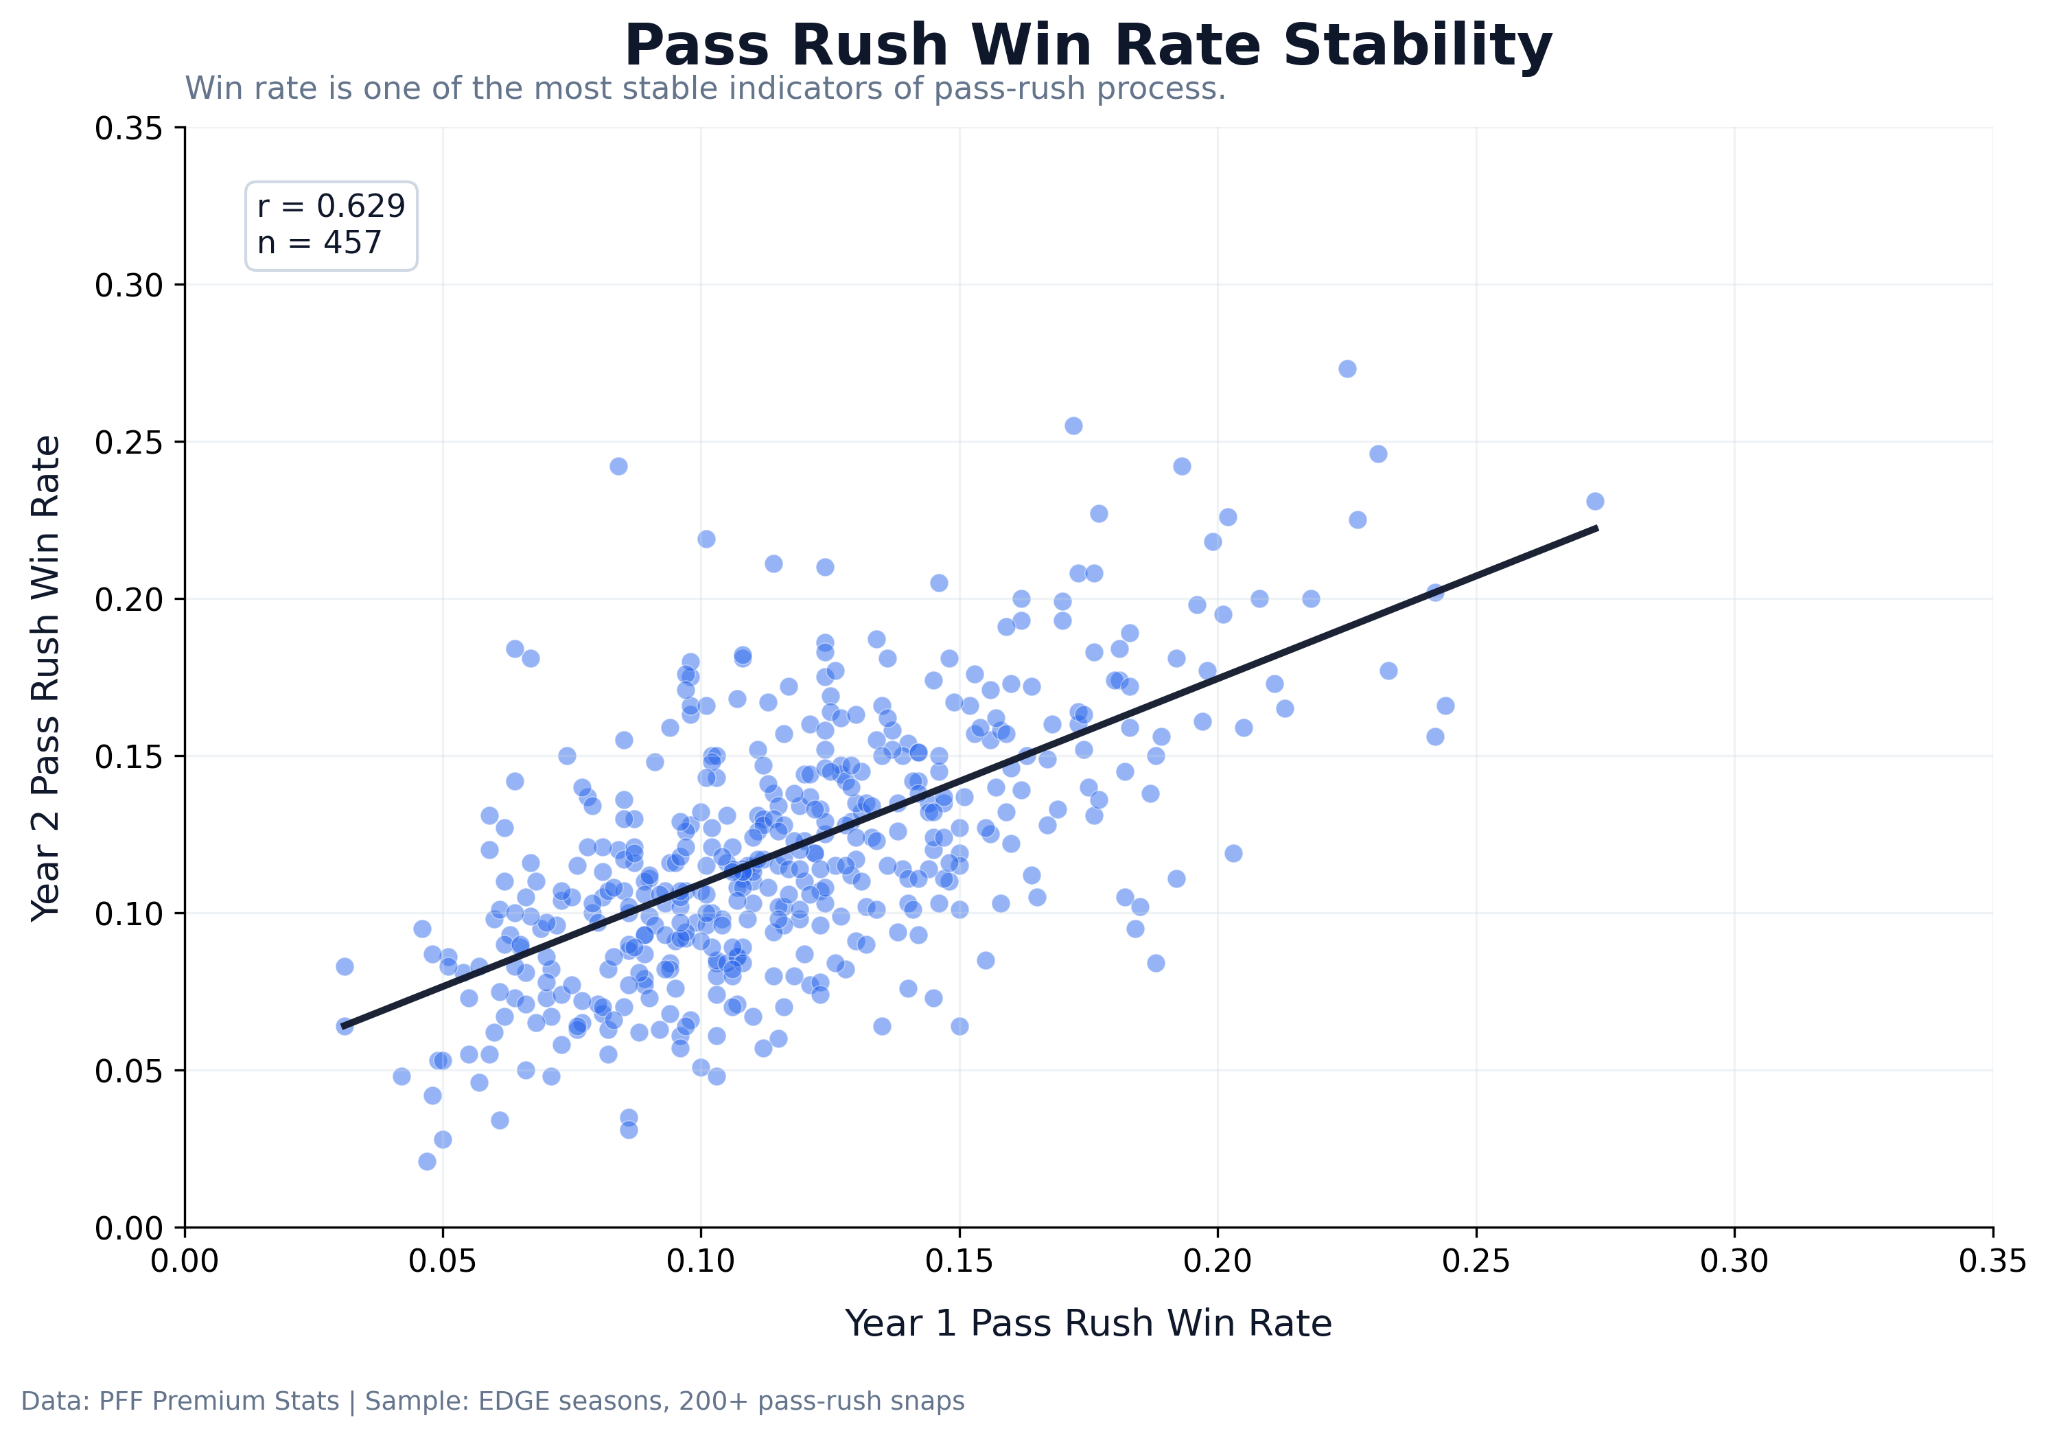
Pass-Rush Win Rate Stability
Pass-rush win rate emerged as one of the strongest indicators of repeatable pass-rush performance.
The year-to-year correlation was:
r = 0.629
Among the metrics studied, win rate showed significantly greater persistence than raw sack production.
This finding suggests that consistently defeating blockers is a sustainable skill that translates across seasons more reliably than final sack outcomes.
Unlike sacks, which depend on whether the quarterback is ultimately brought down, win rate isolates the initial pass-rush victory itself. Because of this, it may better capture underlying pass-rush talent independent of external variance.
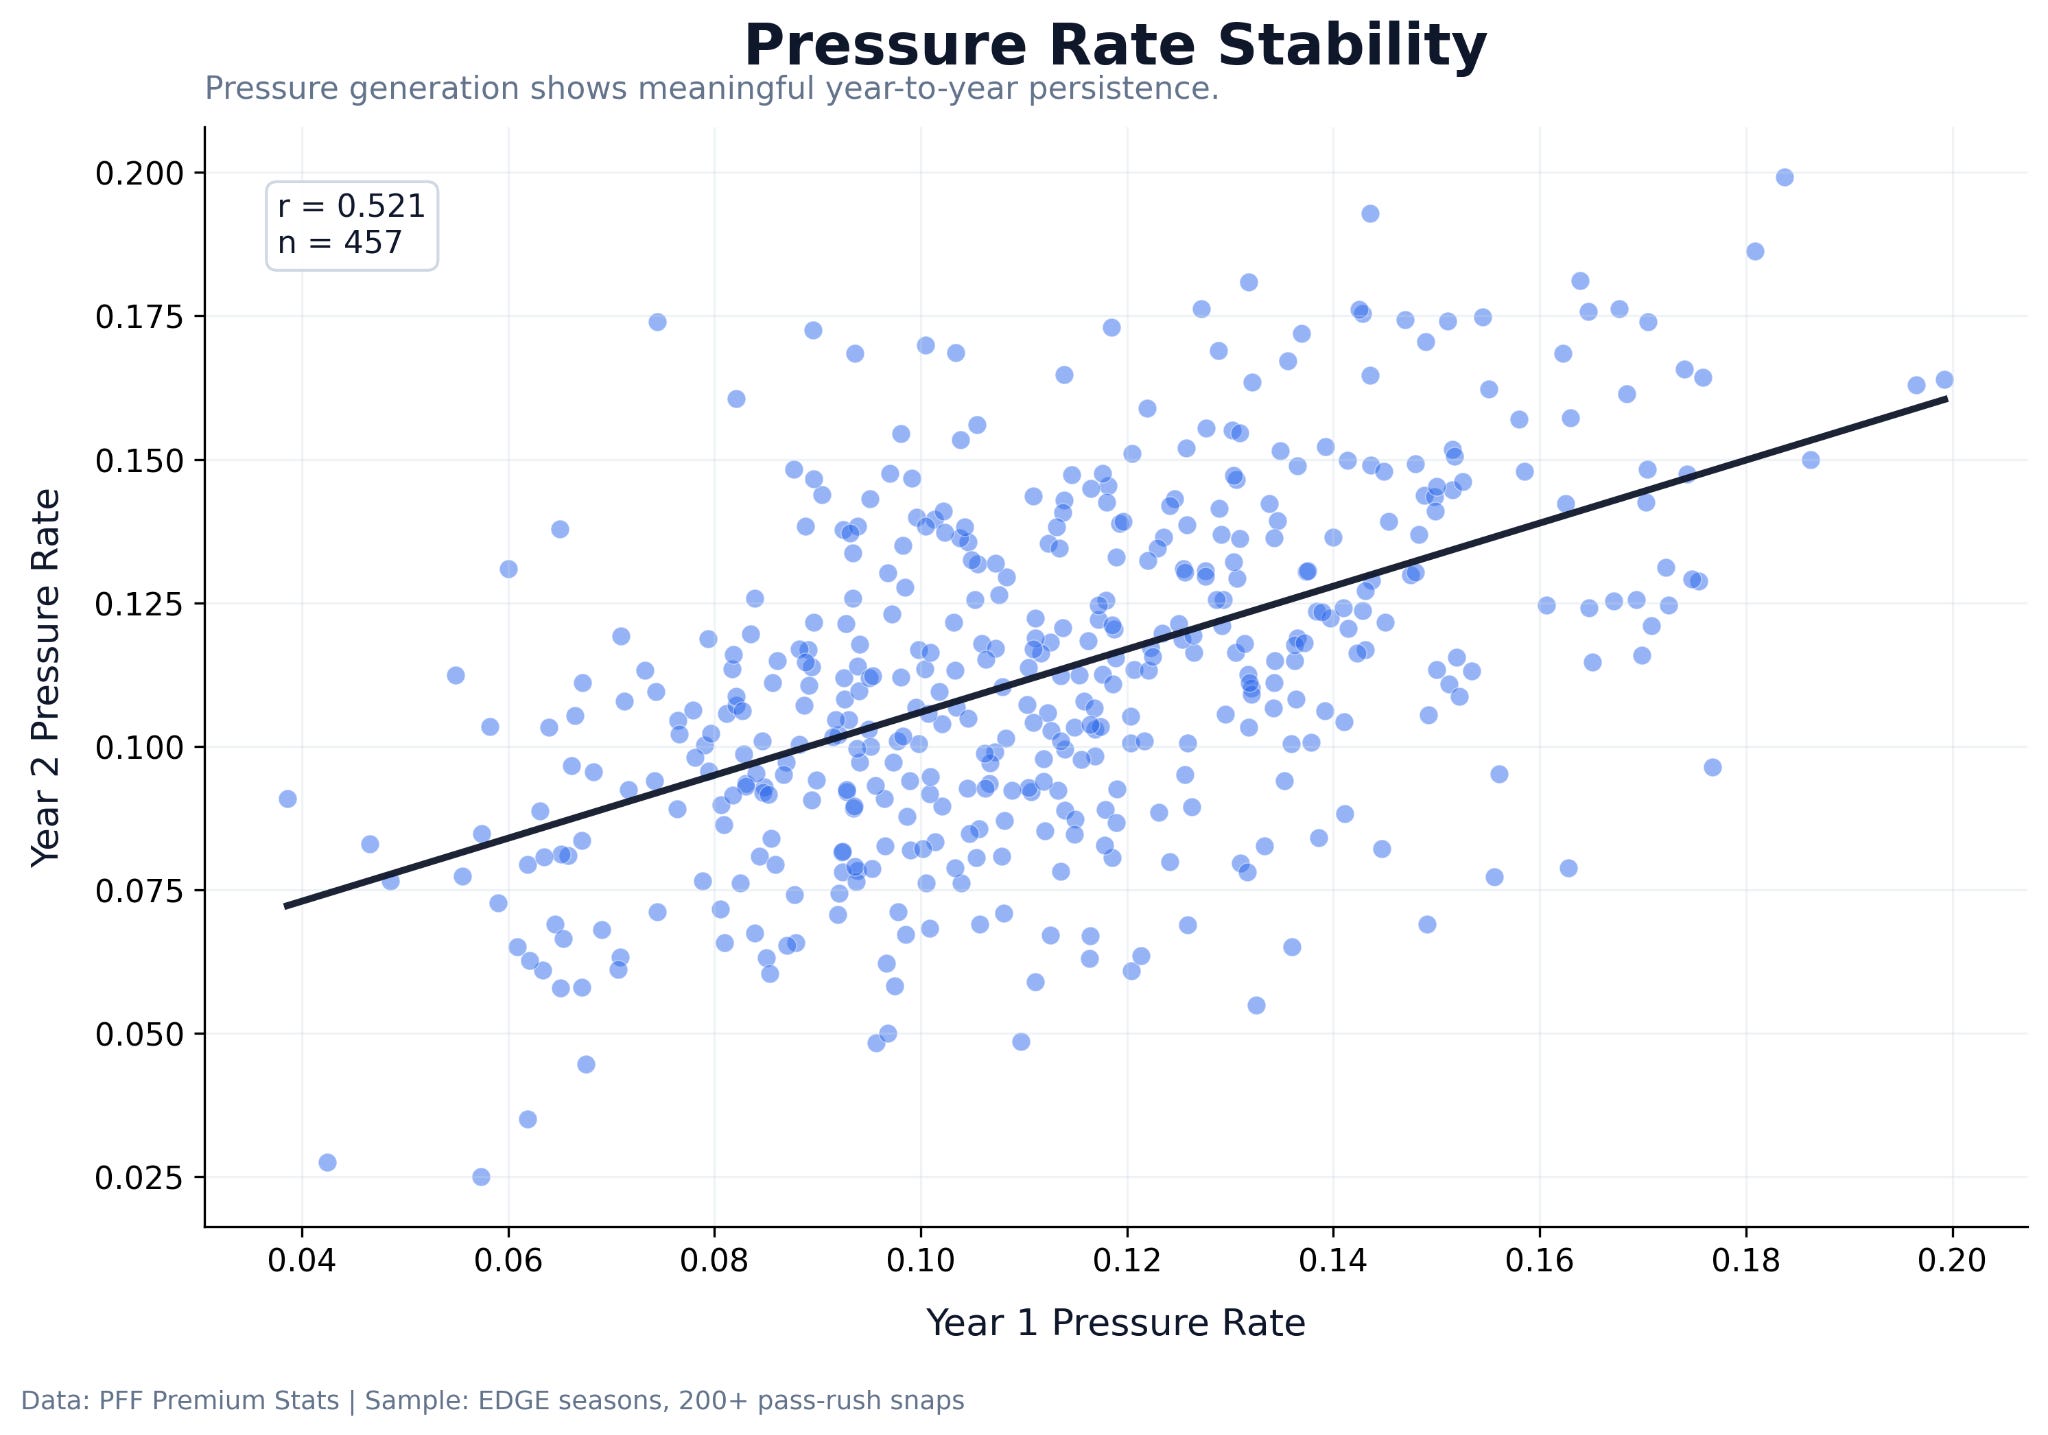
Pressure Rate Stability
Pressure rate also demonstrated meaningful year-to-year persistence.
The observed correlation was:
r = 0.521
This indicates that quarterback disruption is relatively sustainable over time.
Edge defenders who consistently generated pressure in one season generally continued doing so the following year.
Compared to sacks, pressures occur more frequently and therefore may provide a larger and more stable sample of pass-rush effectiveness.
This supports the idea that pressure generation may be a stronger representation of underlying pass-rush skill than sack totals alone.
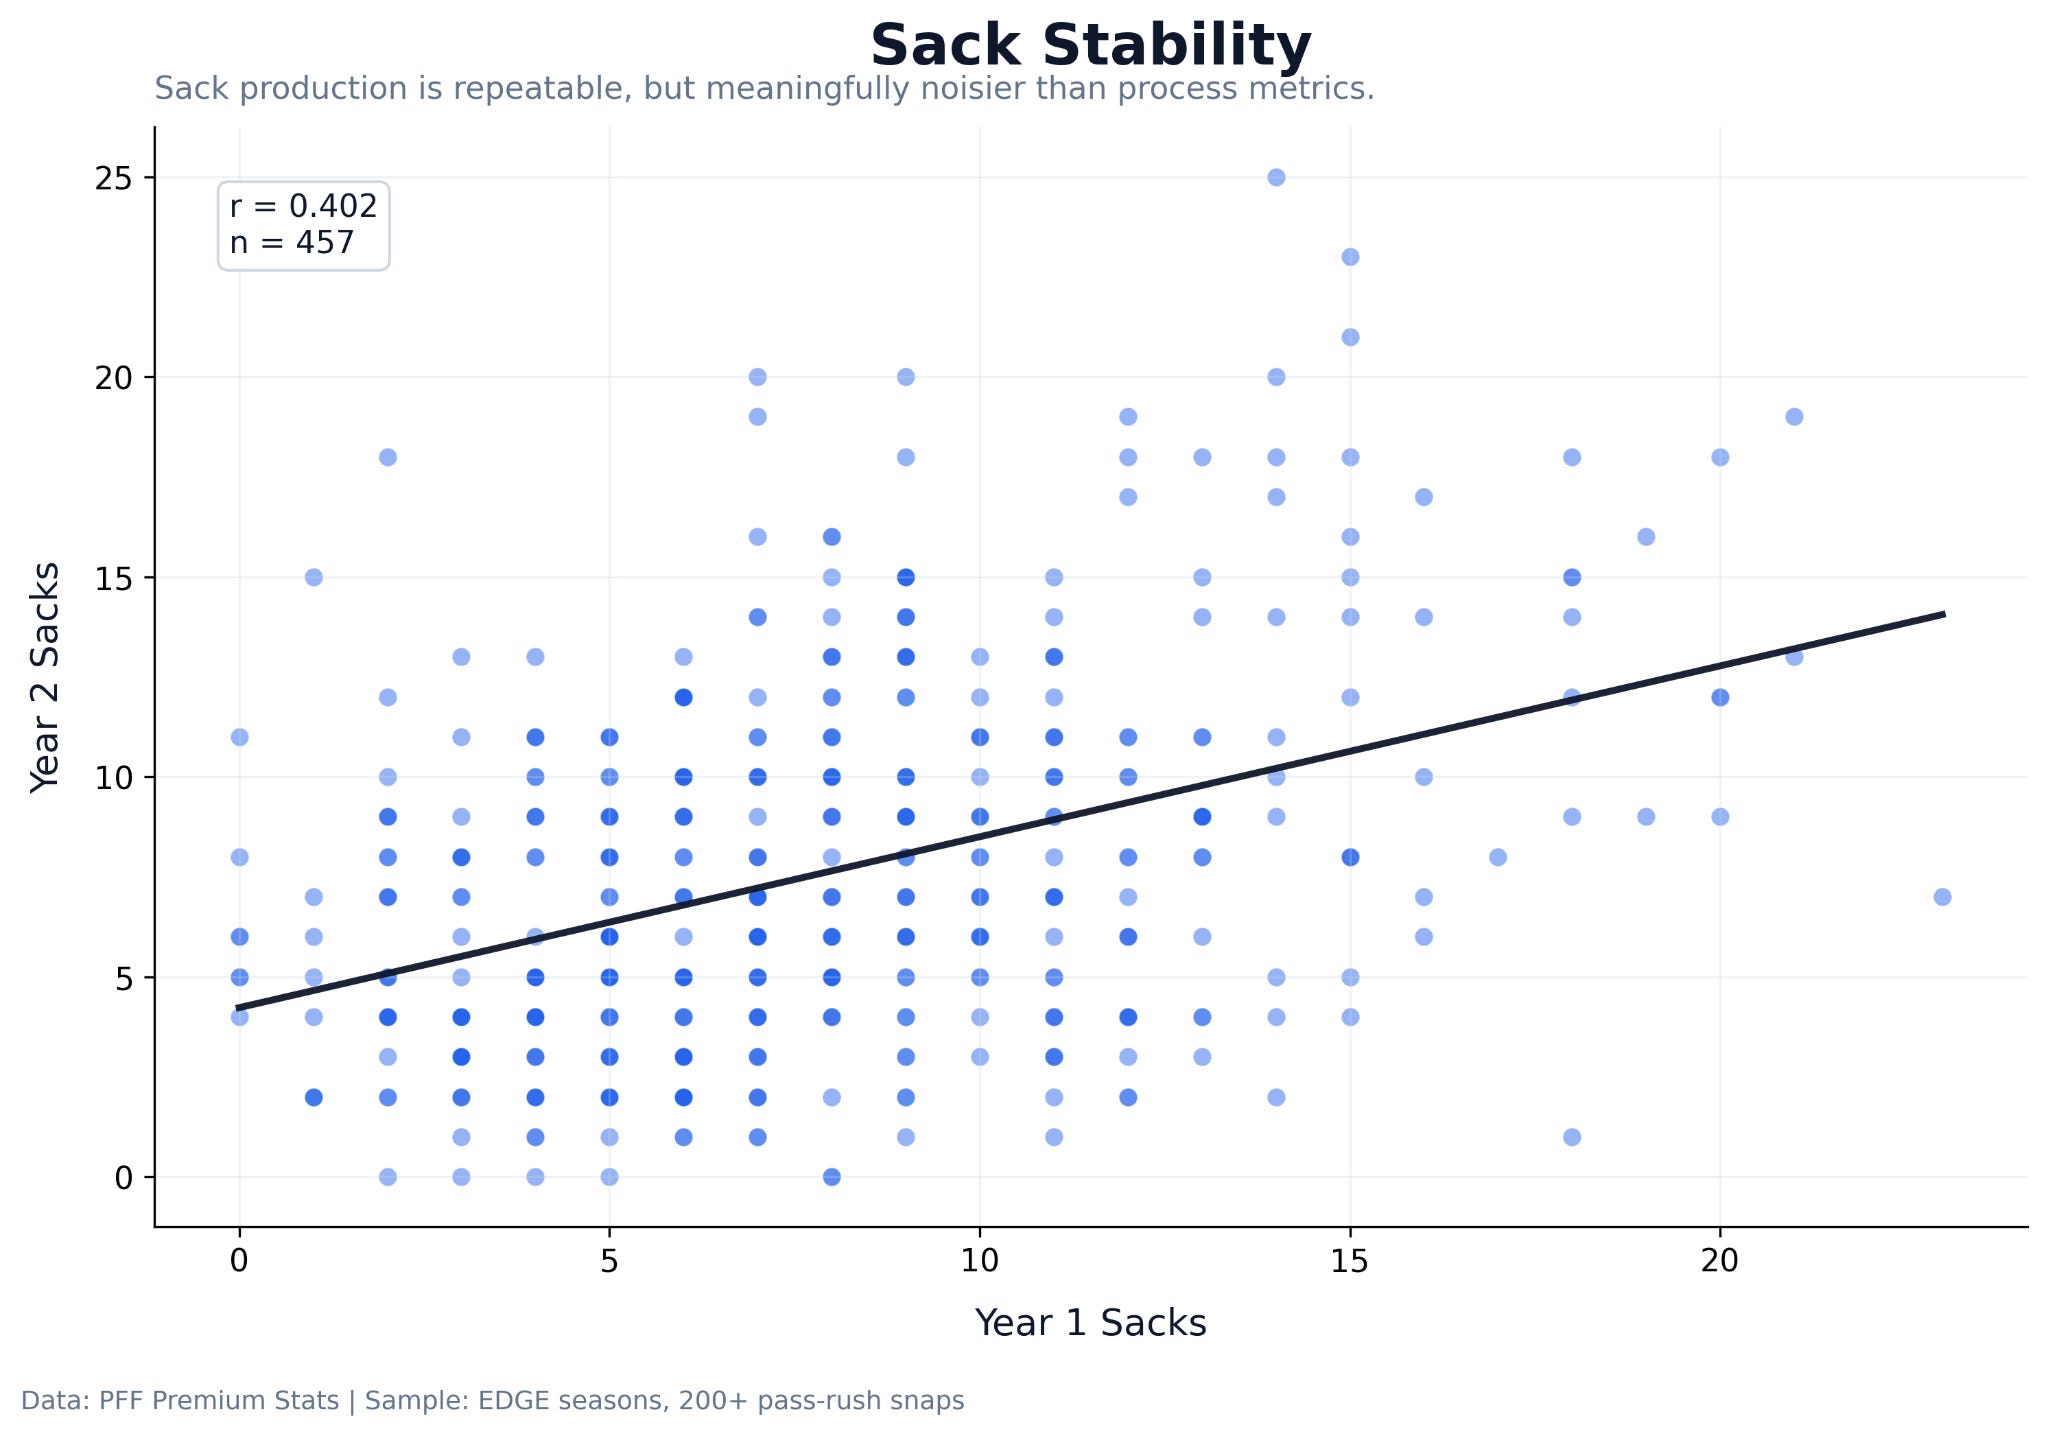
Sack Stability
Sack production demonstrated moderate year-to-year stability.
The observed sack correlation was:
r = 0.402
This suggests that sacks do contain meaningful signals regarding pass-rush ability, but they are substantially noisier than several process-oriented metrics.
Compared to win rate and pressure generation, sack production appears more sensitive to contextual factors such as quarterback movement, coverage timing, play design, and teammate influence.
While sacks remain valuable outcomes, the weaker stability suggests they may not fully capture sustainable pass-rush performance on their own.
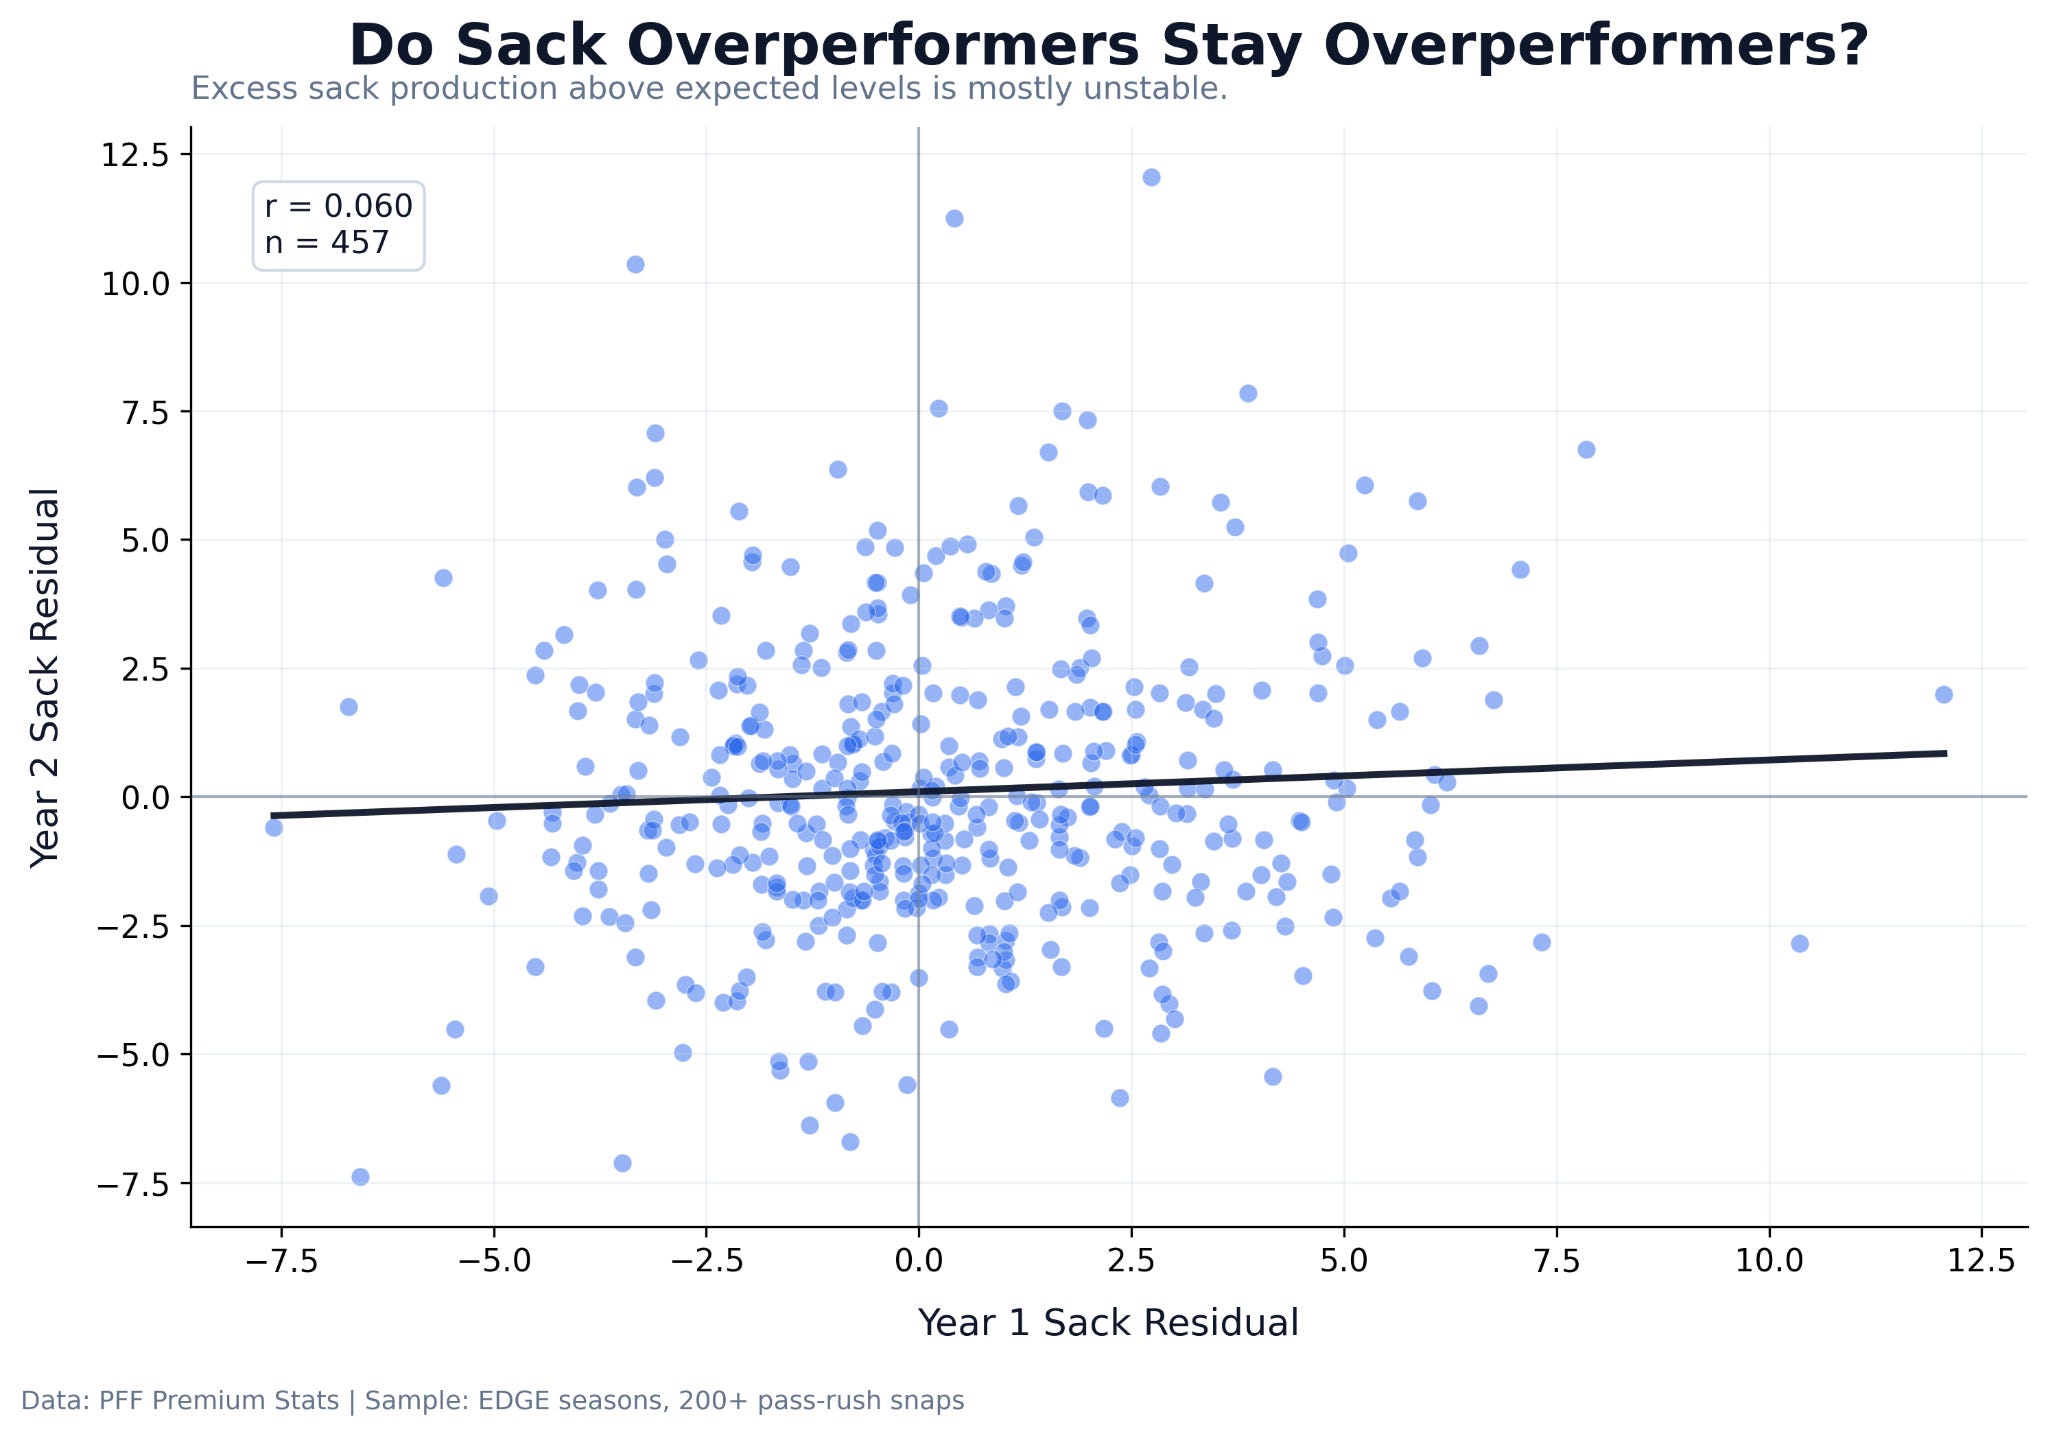
Sack Residual Stability
One of the most important findings of the study involved sack residuals.
Sack residuals were calculated by subtracting expected sacks from actual sacks. Positive residuals represent players who exceeded expected sack production relative to their underlying pressure totals.
The year-to-year correlation for sack residuals was:
r = 0.060
This relationship was extremely weak.
Players who dramatically overperformed expected sack totals in one season generally did not sustain that same level of overperformance in the following seasons.
This finding strongly supports regression toward expected production levels.
Importantly, the result does not imply that sacks are meaningless. Instead, it suggests that unusually efficient sack finishing above expected levels may be highly unstable year to year.
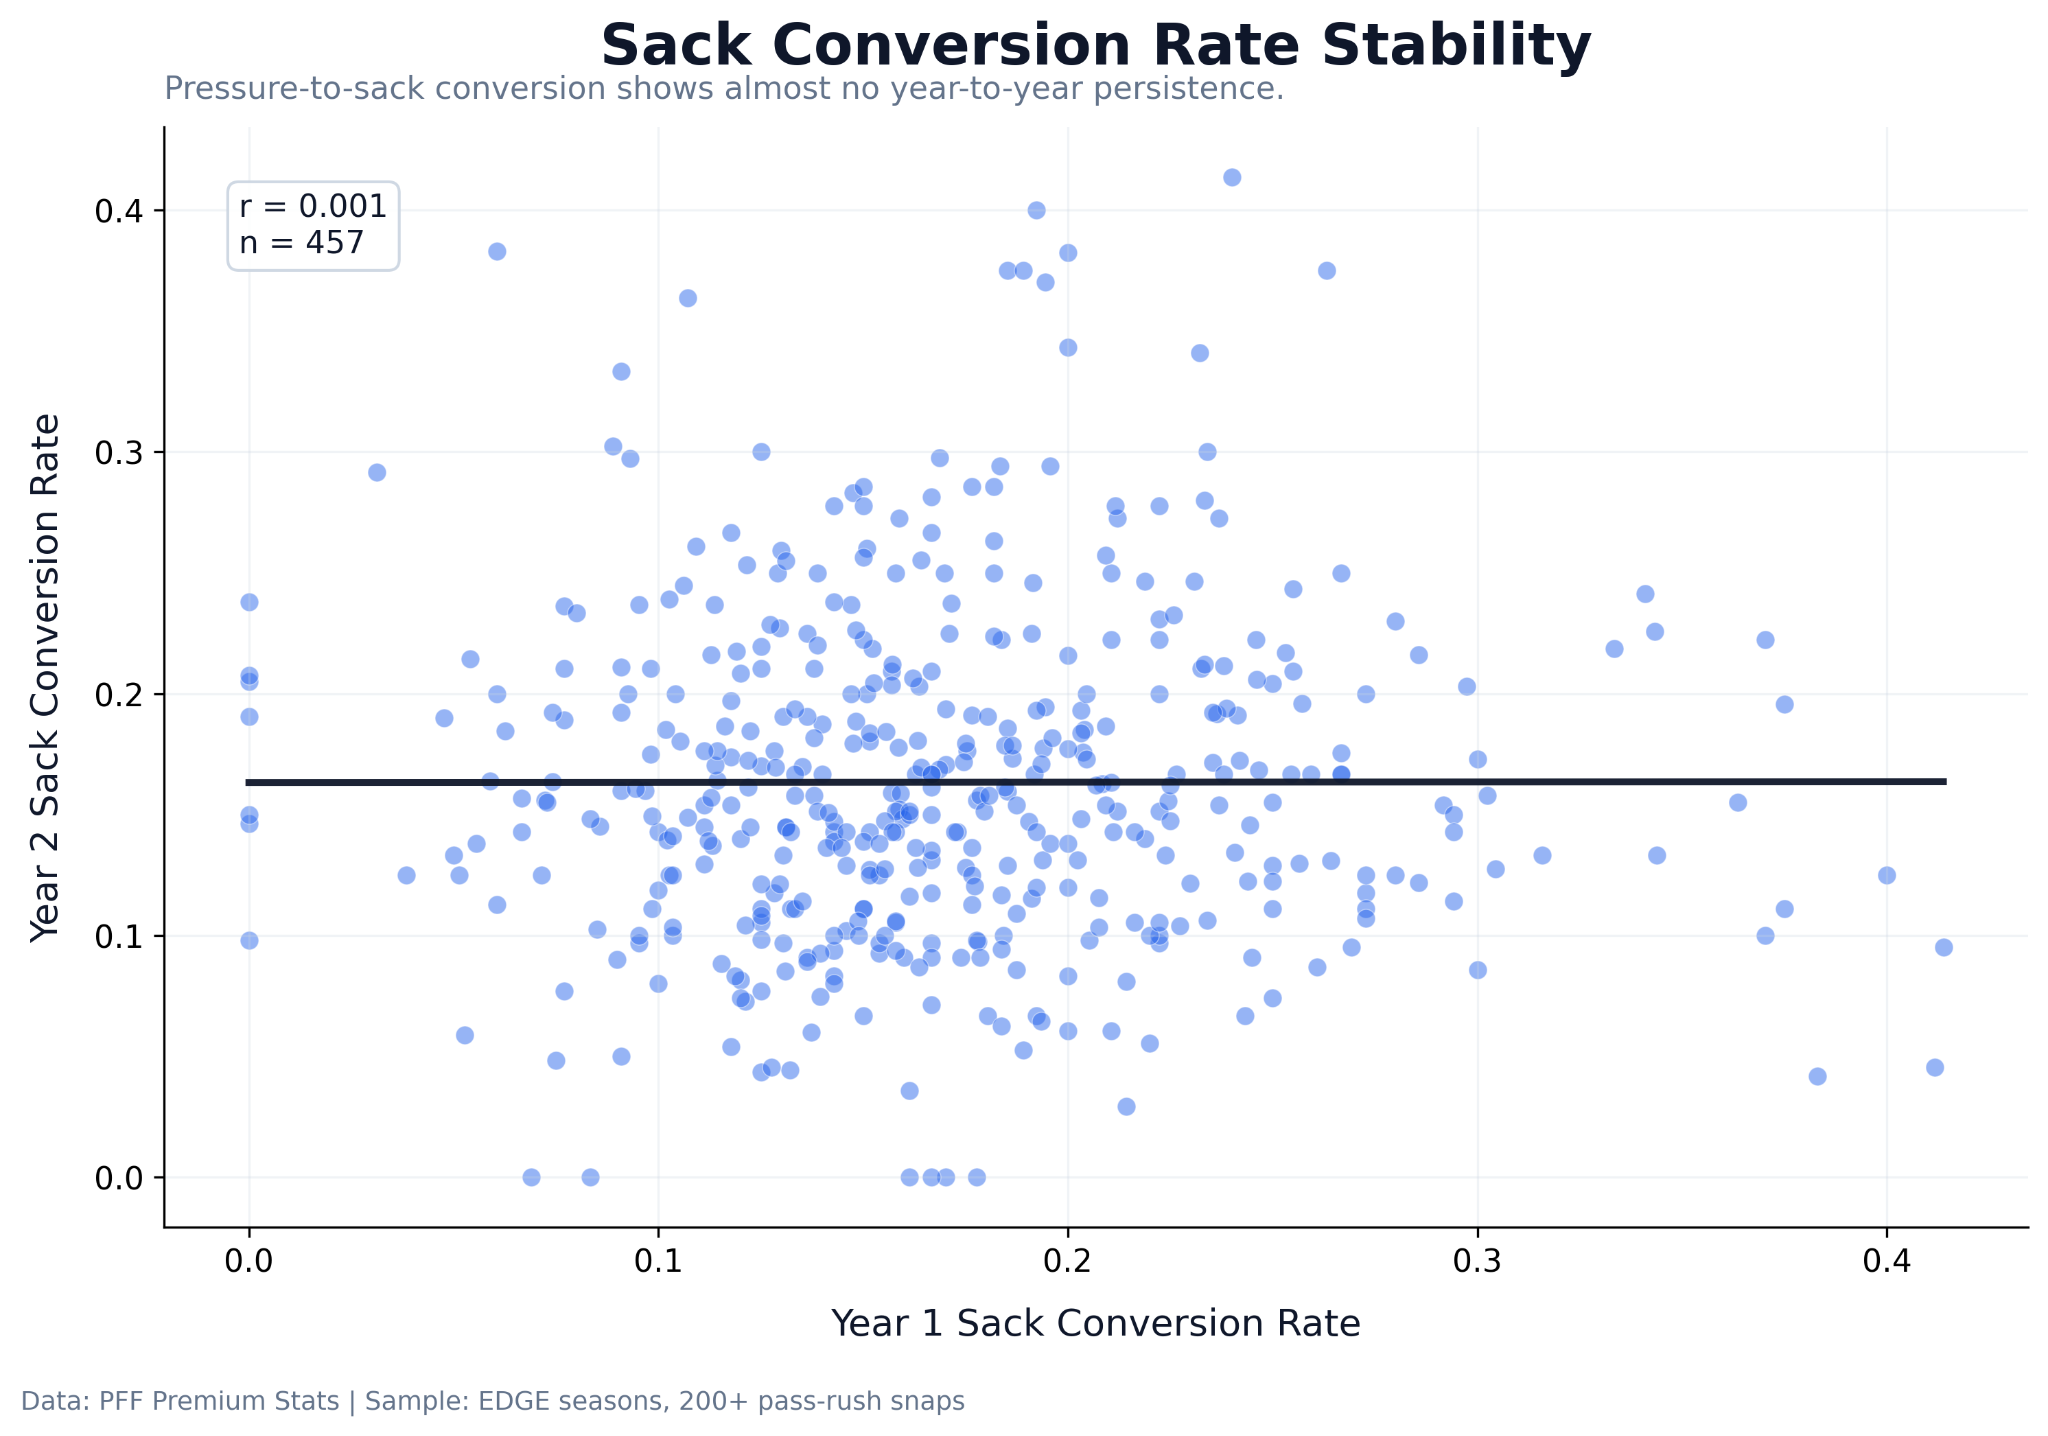
Sack Conversion Rate Stability
Sack conversion rate produced the weakest relationship in the study.
The observed correlation was:
r = 0.001
This indicates almost no year-to-year persistence.
Players who converted pressures into sacks at extremely high rates in one season generally did not maintain those same conversion rates the following year.
The finding suggests that pressure-to-sack conversion may be heavily influenced by variance, situational context, and play-level randomness.
As a result, sack conversion efficiency alone appears to provide limited value as a sustainable evaluation metric.
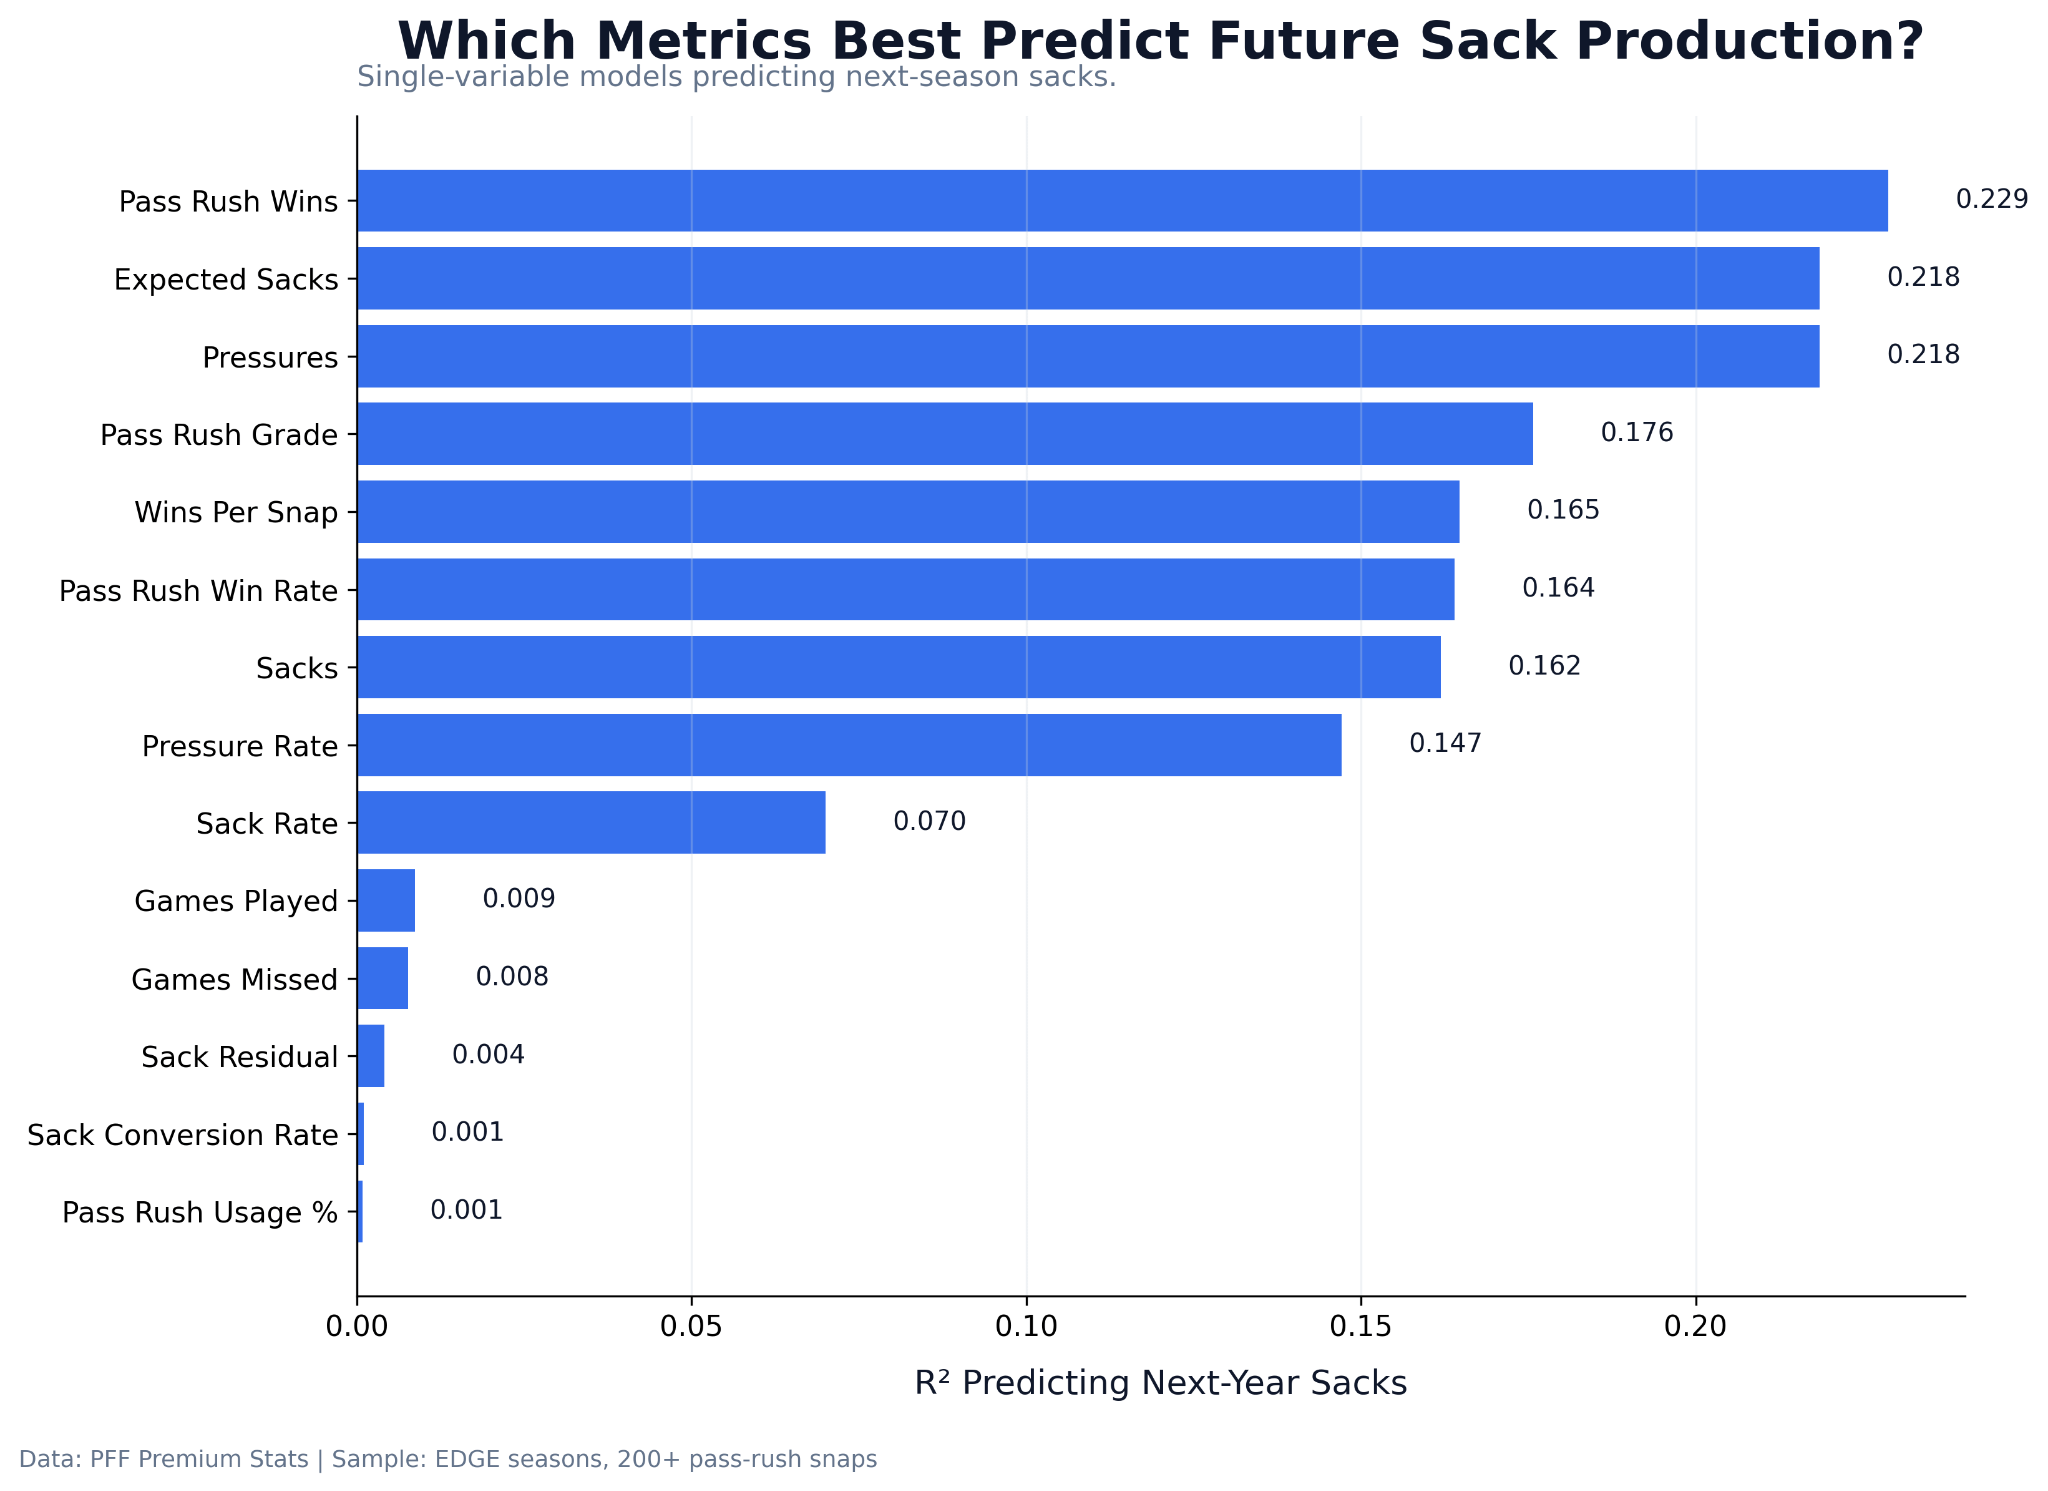
Predicting Future Sack Production
To evaluate predictive strength, Year 1 metrics were individually tested as predictors of Year 2 sack production using linear regression models.
The strongest predictive metrics were:
Pass Rush Wins — R² = 0.229
Expected Sacks — R² = 0.218
Pressures — R² = 0.218
Pass Rush Grade — R² = 0.176
Wins Per Snap — R² = 0.165
Pass Rush Win Rate — R² = 0.164
Sacks — R² = 0.162
Pressure Rate — R² = 0.147
Several outcome-oriented metrics performed substantially worse:
Sack Rate — R² = 0.070
Sack Residual — R² = 0.004
Sack Conversion Rate — R² = 0.001
The predictive hierarchy consistently favored process-oriented pass-rush metrics over outcome-based efficiency statistics.
Pass-rush wins, expected sacks, and pressures all outperformed raw sack totals when projecting future sack production.
Limitations
Several limitations should be acknowledged.
First, many pass-rush statistics rely on charting and grading systems that involve some subjectivity. Metrics such as pressures, hurries, and pass-rush wins are not universally defined across data providers, and different charting systems may classify pass-rush outcomes differently.
Second, the analysis does not fully isolate contextual variables such as defensive scheme, surrounding talent, coverage quality, offensive competition, or quarterback tendencies.
Third, correlation does not prove causation. A stable metric is not automatically a perfect representation of skill, but rather a metric that tends to persist more consistently over time.
Additionally, while several metrics demonstrated stronger stability than others, none of the observed relationships were overwhelmingly strong. Even the strongest correlations still leave substantial year-to-year unexplained variance, highlighting the inherently volatile and context-dependent nature of pass-rush production. As a result, these findings should be interpreted as evidence of relative stability rather than definitive predictive certainty.
Finally, the study focused primarily on single-variable relationships. More advanced multivariable modeling could potentially improve predictive performance and further separate stable pass-rush traits from contextual variance.
Conclusion
This study examined the year-to-year stability and predictive power of multiple NFL edge pass-rush metrics using consecutive-season data from 2016 through 2024.
The results consistently showed that process-oriented metrics such as pass-rush win rate, pressures, and pressure rate were substantially more stable than sack conversion metrics and sack overperformance measures.
Meanwhile, sack residuals and sack conversion rate demonstrated almost no persistence across seasons.
The findings suggest that sustainable pass-rush evaluation may be better achieved through repeatable disruption metrics rather than isolated sack outcomes alone. However, the difficulty of predicting future pass-rush production may also reflect the importance of factors beyond pass-rush skill itself, particularly player health and long-term availability.
Overall, the study supports a broader analytical framework in which consistent pressure generation and blocker-defeating ability provide stronger indicators of long-term pass-rush talent than volatile sack efficiency metrics.