
Projecting Future Pass-Rush Production Using a Confidence Interval

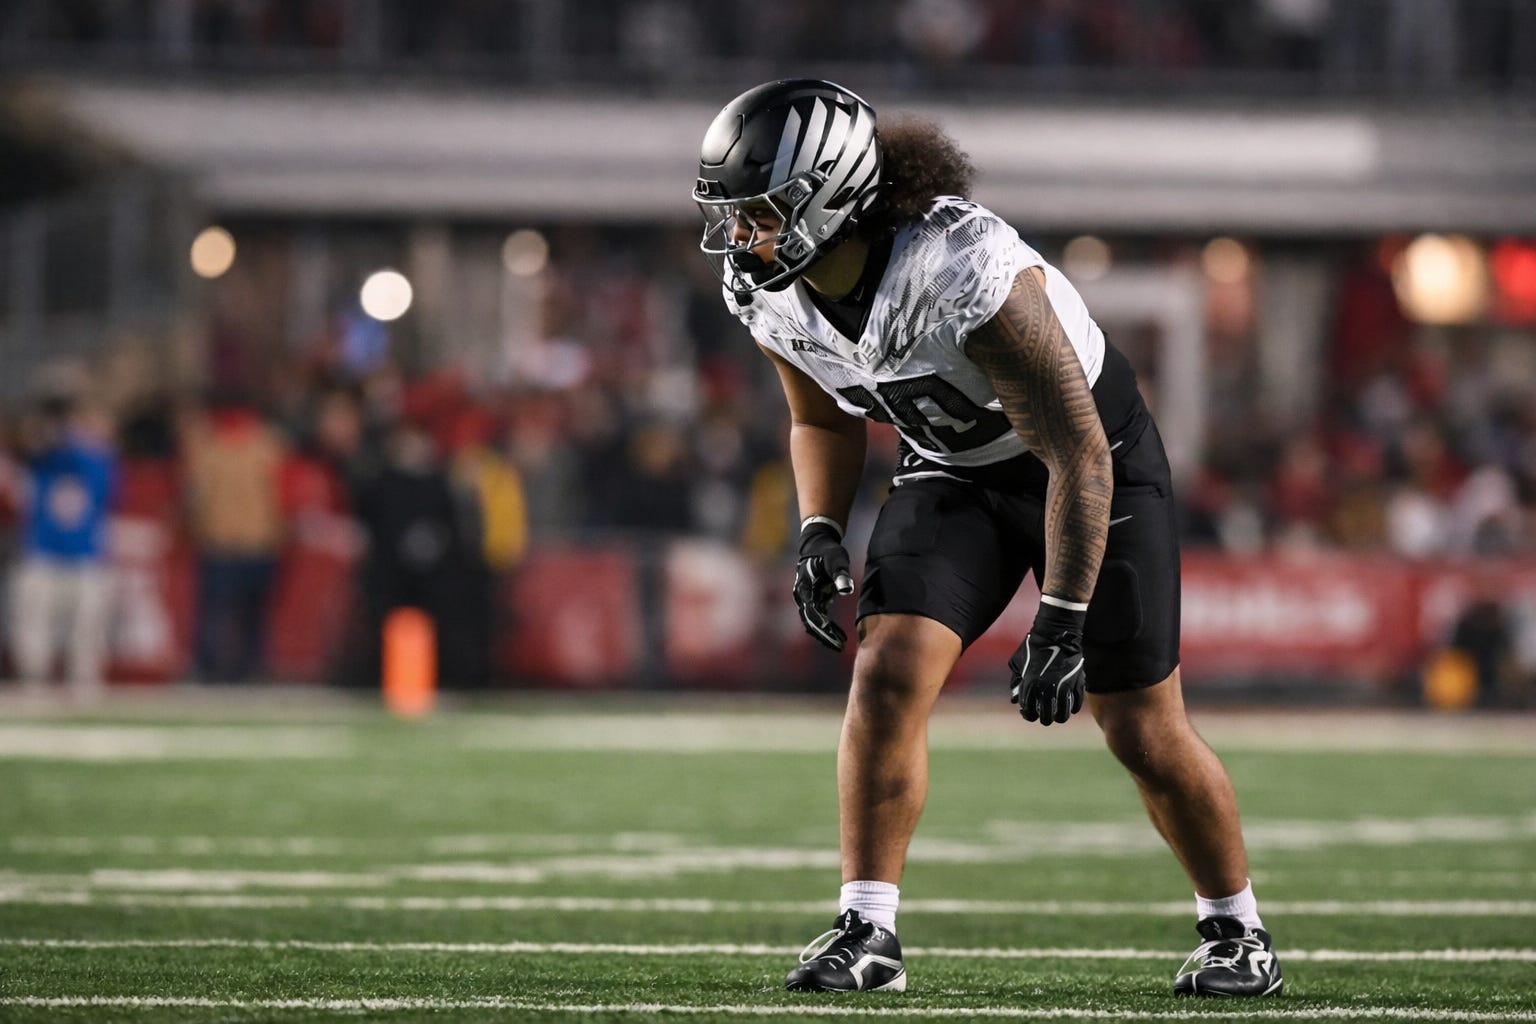
Image: Oregon Athletics / GoDucks.com, cropped and edited by author
Introduction
Single-season pass-rush metrics are often noisy and can vary significantly from year to year, which makes them difficult to use as reliable predictors of future performance. Because of this variability, statistical inference can be used to estimate a reasonable range for a player’s underlying pass-rush efficiency rather than assuming that a single season’s results perfectly reflect their ability.
By constructing a confidence interval around a player’s pressure rate, we can estimate a range for their true pass-rush ability and translate that range into a projected interval for future production. This approach provides a more uncertainty-aware way to evaluate pass-rush performance than relying on a single observed statistic.
Case Study: Matayo Uiagalelei
For this analysis, I will use Matayo Uiagalelei of the Oregon Ducks. Uiagalelei is a useful case study because he accumulated a large number of pass-rush snaps at a major program and has chosen to return to Eugene for his senior season, making his future performance particularly relevant to the project.
During the 2025 season, Uiagalelei recorded 47 pressures across 338 pass-rush snaps.
Methodology
To estimate Uiagalelei’s underlying pass-rush efficiency, a 95% confidence interval for his pressure rate is constructed using the sample proportion method.
First, the observed pressure rate is calculated:
p-hat = 47 / 338
p-hat = 0.13905
Next, the standard error of the sample proportion is calculated using the formula:
SE = sqrt[(p-hat(1 − p-hat)) / n]
Substituting the values gives:
SE ≈ 0.0188
Using the standard 95% confidence interval formula
p-hat ± 1.96(SE)
we obtain:
0.13905 ± 1.96(0.0188)
Confidence Interval = (0.1022, 0.1759)
Interpretation of the Confidence Interval
This means we are 95% confident that Uiagalelei’s true underlying pressure rate lies between approximately 10.2% and 17.6%.
Although his observed pressure rate during the 2025 season was about 13.9%, statistical uncertainty suggests that his true pass-rush efficiency likely falls somewhere within this broader range.
Projecting Future Production
To convert this efficiency range into a projection for next season, we assume Uiagalelei receives the same number of pass-rush snaps (338).
Multiplying the lower and upper bounds of the interval by the projected snap count gives:
338 × 0.1022 = 34.5
338 × 0.1759 = 59.5
This produces a projected pressure range of approximately 35 to 59 pressures.
If Uiagalelei receives a similar number of pass-rush opportunities and his underlying pass-rush ability remains within the estimated range, his pressure production next season would likely fall somewhere between roughly 35 and 59 pressures.
Limitations
This projection should not be interpreted as a guaranteed outcome. Future performance can vary due to factors such as opponent strength, scheme changes, role adjustments, health, and normal year-to-year variation in pass-rush outcomes.
In addition, this analysis relies on data from a single season, which may not fully capture a player’s long-term performance level.
Conclusion
Single-season pass-rush metrics can provide useful information, but they are often influenced by randomness and limited sample sizes. By constructing a confidence interval around pressure rate, analysts can estimate a plausible range for a player’s true pass-rush efficiency and convert that range into a more realistic projection for future production.
While this approach does not eliminate uncertainty, it provides a more statistically grounded way to evaluate pass-rush performance.